Every year, Black Friday sales grow and it becomes a more significant part of your ecommerce marketing strategy. For retailers hoping to make a killing on sales, it’s useful to have a solid understanding of the statistics behind the phenomenon.
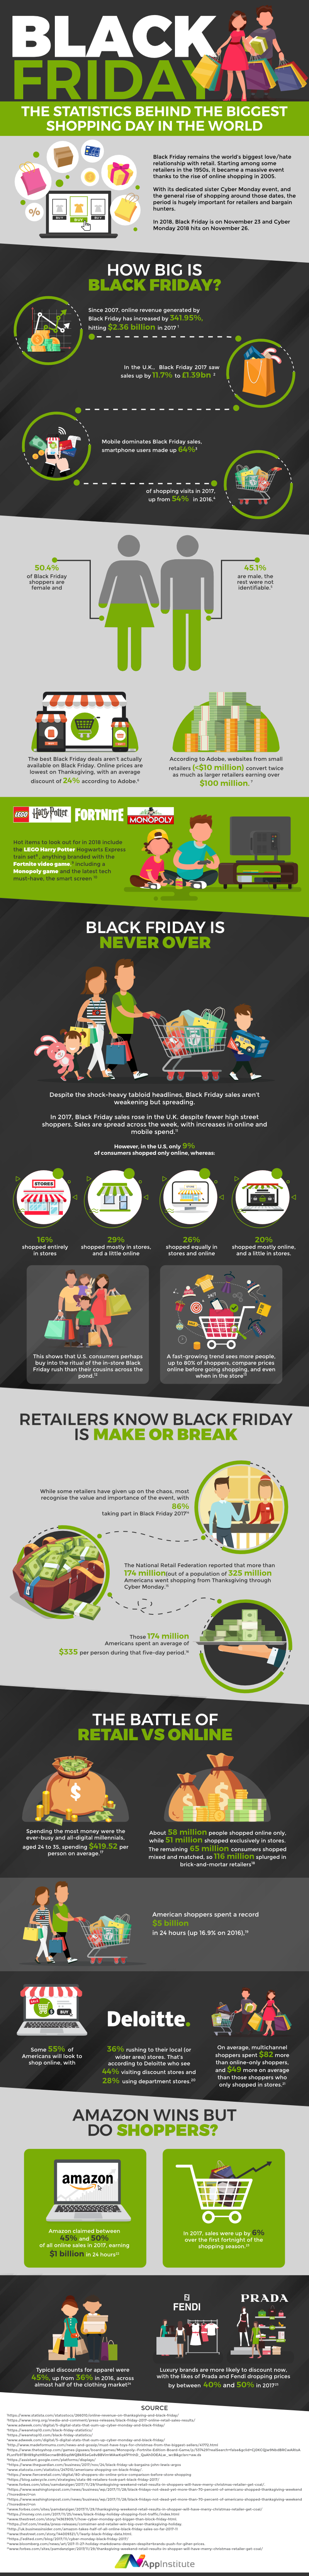
Check out our handy infographic courtesy of AppInstitute that delves into the facts and figures of Black Friday over the past decade. It touches on the shift from in-store to online sales and the evolution from desktop domination to mobile madness when it comes to volume of sales.
The infographic also covers when shoppers can get the best deals and analyses the demographics of the typical Black Friday shopper: by gender, shopping habits and a comparison between UK and US shoppers.
Ready to learn more about Black Friday’s success and the stats behind it?